Reflection Across a Line With Python and Linear Algebra
Symetry and Reflection
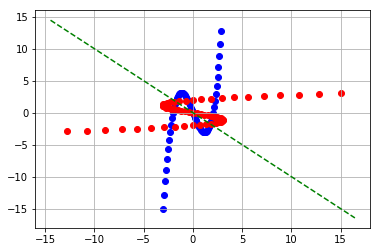
The other day my son came home with a math assignment involving symetry and reflection. He is in High School, and so the challenge with the homework went beyond what he had in middle school where students look at geometric figures and say if they have horizontal, vertical or radial symmetry. The challenge for his assignment was to draw the symmetric reflection of a function across an arbitrary line through the origin. This is an interesting and fun exercise with a pencil.
I figured I would try and see if I could accomplish the same thing with a little linear algebra.
To begin with, we need the formula for an arbitrary line through the origin. (Note, I am going to do this with lines as that was part of his assignment. It is possible, and a bit easier to do this by going with polar coordinates.)
The formula for a line in two dimensions through the origin looks like this:
\[y=mx\]Using m (slope) in that formula, a reflection matrix looks like this:
\[R = \frac{1}{1+m^2}\begin{bmatrix} 1-m^2 & 2m \\ 2m & m^2 -1 \\ \end{bmatrix}\]Check out this article for information on Householder transformation if you want to dive into the derivation of this formula.
With that handy tool, it is possible to implement a little python code to reflect an arbitrary function across a line. Here is an example:
import numpy as np
from matplotlib import pyplot as plt

plt.grid(True)

# y=mx
m=-1

# Define the domain of the function
xmin = -3.0
xmax = 3.0
step = 0.1

# This function uses a transformation matrix to return the point
# that is reflected across the line y=mx for m defined above.

def reflect(x,y):
    xhat = np.array([x,y]).T
    matrix = np.array([[1-m**2, 2*m],[2*m, m**2 -1]])
    matrix = matrix * (1/(1+m**2))

    R = matrix.dot(xhat)
    return R

# This is the function that we want to reflect
def f(x):
    return x**3-4*x

vec = np.vectorize(f)
X = [x for x in np.arange(xmin, xmax, step)]
Y = [y for y in vec(X)]

#Plot the function:
plt.scatter(X,Y,color="b")

# Here we use the transformation matrix function we defined above:
Z = zip(X,Y)

for x,y in Z:
    r = reflect(x,y)
    plt.scatter(r[0],r[1],color="r")


# Here we draw the line we reflected across...

x_range = plt.gca().get_xlim()

X_LINE = [x for x in np.arange(x_range[0],x_range[1], 0.1)]

def f2(x):
    return m*x

lvec = np.vectorize(f2)
Y_LINE = [y for y in lvec(X_LINE)]

plt.plot(X_LINE, Y_LINE, color='g', linestyle='dashed')
plt.show()
The resulting graph looks like this:

I hope you have enjoyed this (long overdue) blog post.
Stay tuned for more to come…
Miles.