Using R to Explore Data on Global Terrorism
Introduction
On August 5th, 2017 the Dar Al-Farooq Islamic Center in Bloomington, MN was attacked with an improvised explosive device. The attack has shocked and saddened many of us in the Twin Cities. We like to think of our city and state as a place for tolerance and diversity. Unfortunately, this attack has shown that we are susceptible to senseless violence like so many other people in our country and around the world.

On September 11th, 2001, terrorists attacks on New York and Washington D.C. resulted in 2759 deaths and 8700 injuries. Unfortunately, as we all know, that was not the only terrorist attack to happen in the United States. Other notable attacks include the intentional crash of an Egypt Air flight in 1999 off of Nantucket Island, the truck bombing of the federal building in Oklahoma City in 1995, and the night club shooting in Orlando in 2016. After those horrible events, the next biggest attack in the US dates all the way back to the Wall Street bombing of 1920.

In 2009, Tori DeAngelis wrote an article for the American Psychological Association Monitor publication titled “Understanding Terrorism”. That article explores some of the research on why people commit terrorist acts and the techniques to predict and prevent those acts. The goal of this post is not to explore motivations of terrorists or predict attacks, but rather to explore the factual data associated with the attacks. This post will focus on exploring these questions with the R statistical programming environment.
University of Maryland Global Terrorism Database
The first step in analyzing the data around terrorism is to gain access to some raw data. One of the resources mentioned by Ms. Wright in her article is the Global Terrorism Database (GTD) provided by The University of Maryland. This database provides information on over 170,000 terrorist attacks. The data contains attacks from 1/1/1970 through 12/30/2016.
Where Do the Attacks Occur
The most basic question we can ask about this data set is where do the attacks happen. The GTD dataset includes geolocation information for each attack. We can use R to plot these locations on a map. However, before the data can be displayed, the appropriate packages need to be installed in R. This post by Eric C. Anderson contains information on how to configure R for displaying maps.
Once R has been configured and the data loaded, the process to plot the attacks on a map can be done as follows:
> gtd = csv.read("/Users/milesporter/data-science/data-sets/GTD_0617dist/globalterrorismdb_0617dist.csv")
#USING MAPS
> map("world", fill=TRUE, col="white", bg="lightblue", ylim=c(-60, 90), mar=c(0,0,0,0))
> points(gtd$latitude, gtd$longitude, col="red")
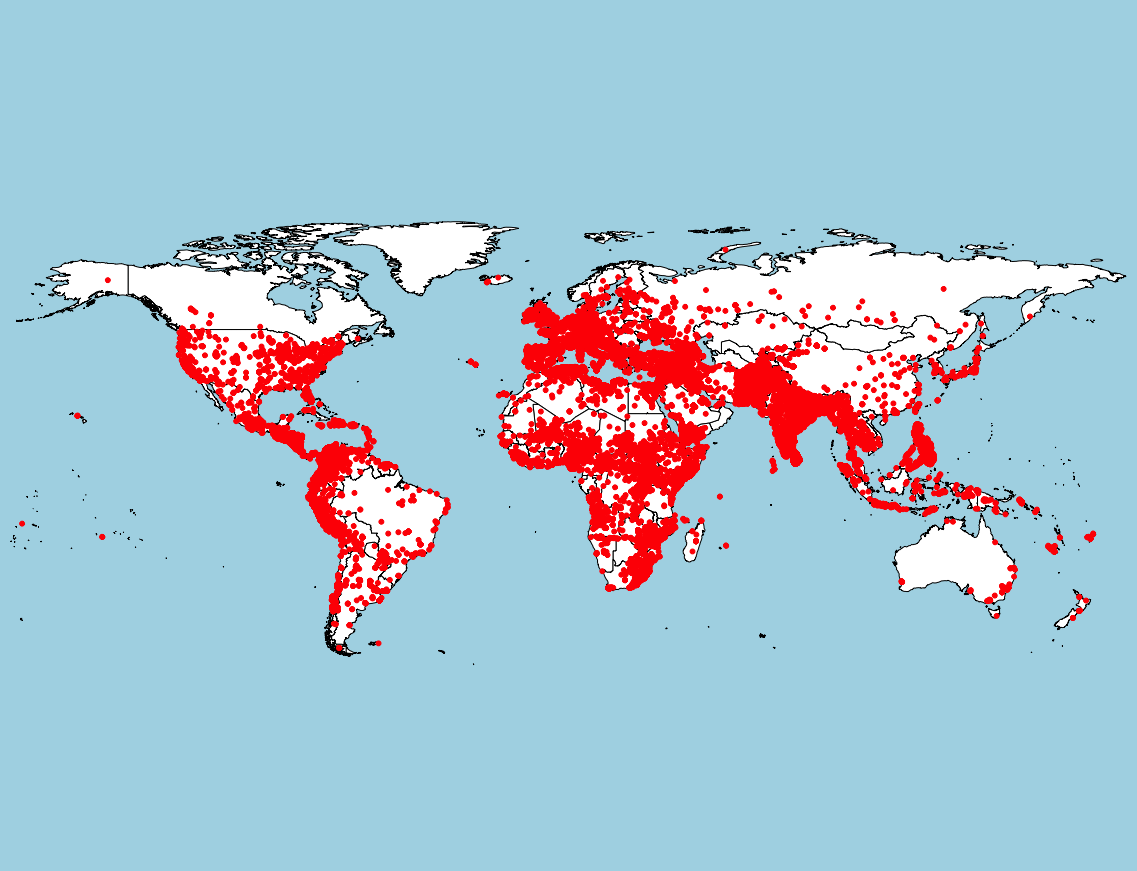
The following graph displays all of the attacks included in the GTD. The data includes both successful and unsuccessful attacks. (170,350 attacks.)
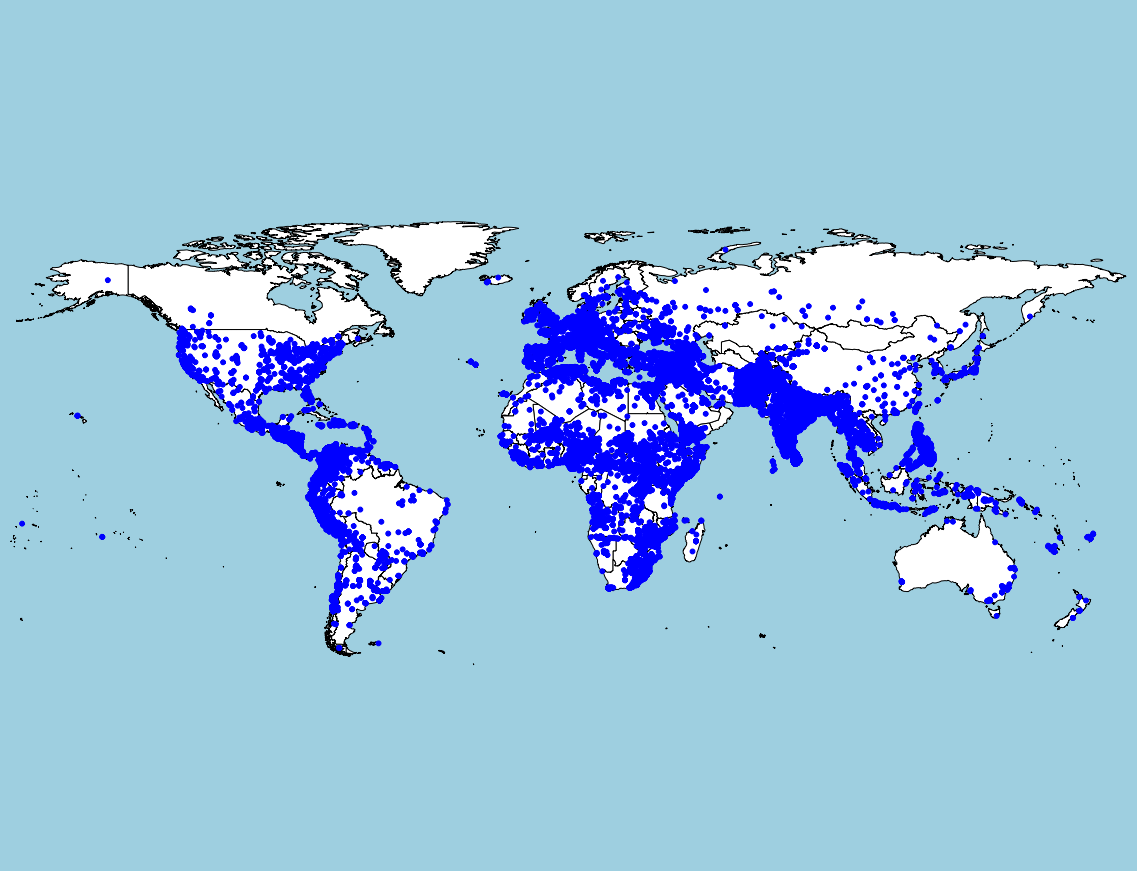
Further limiting the attacks to just those that were successful, we get the following graph. (152,701 attacks)
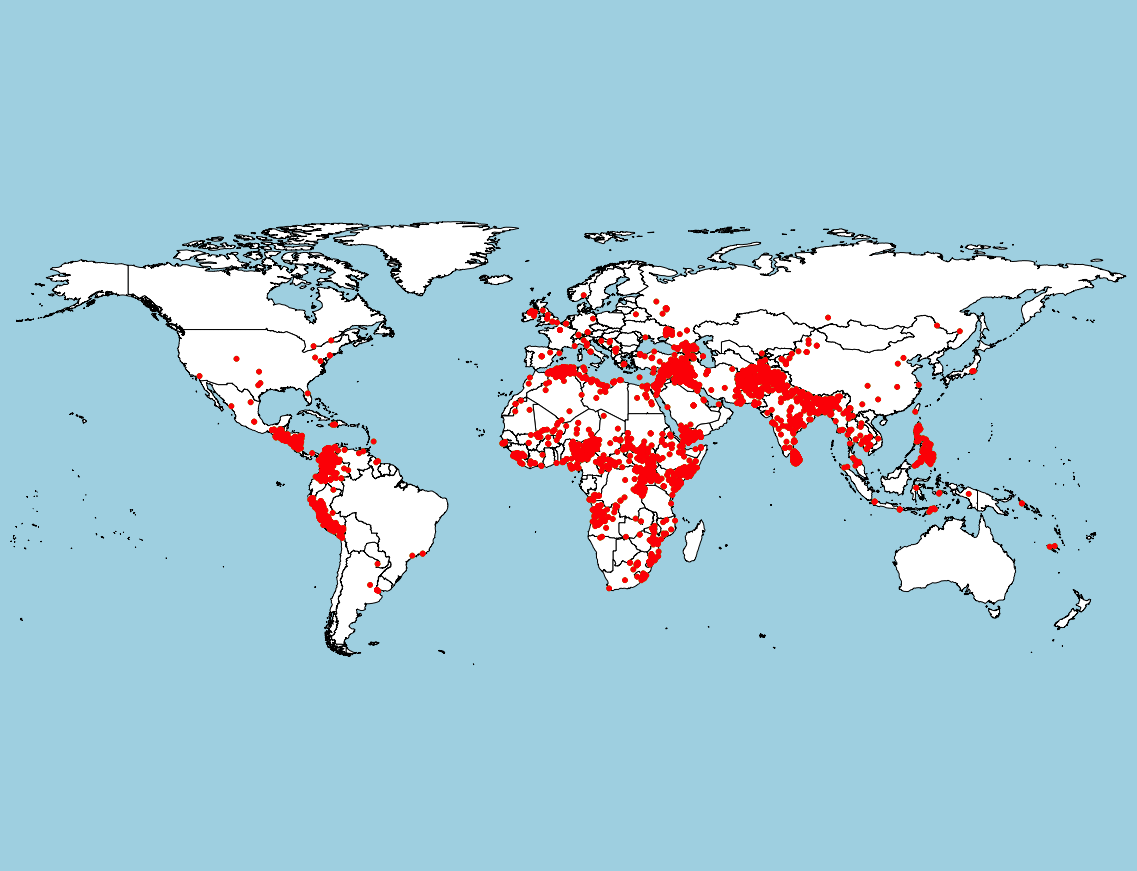
If we further limit the attacks to those that resulted in a known number of deaths of at least 10 people, we have the following: (8,304 attacks)
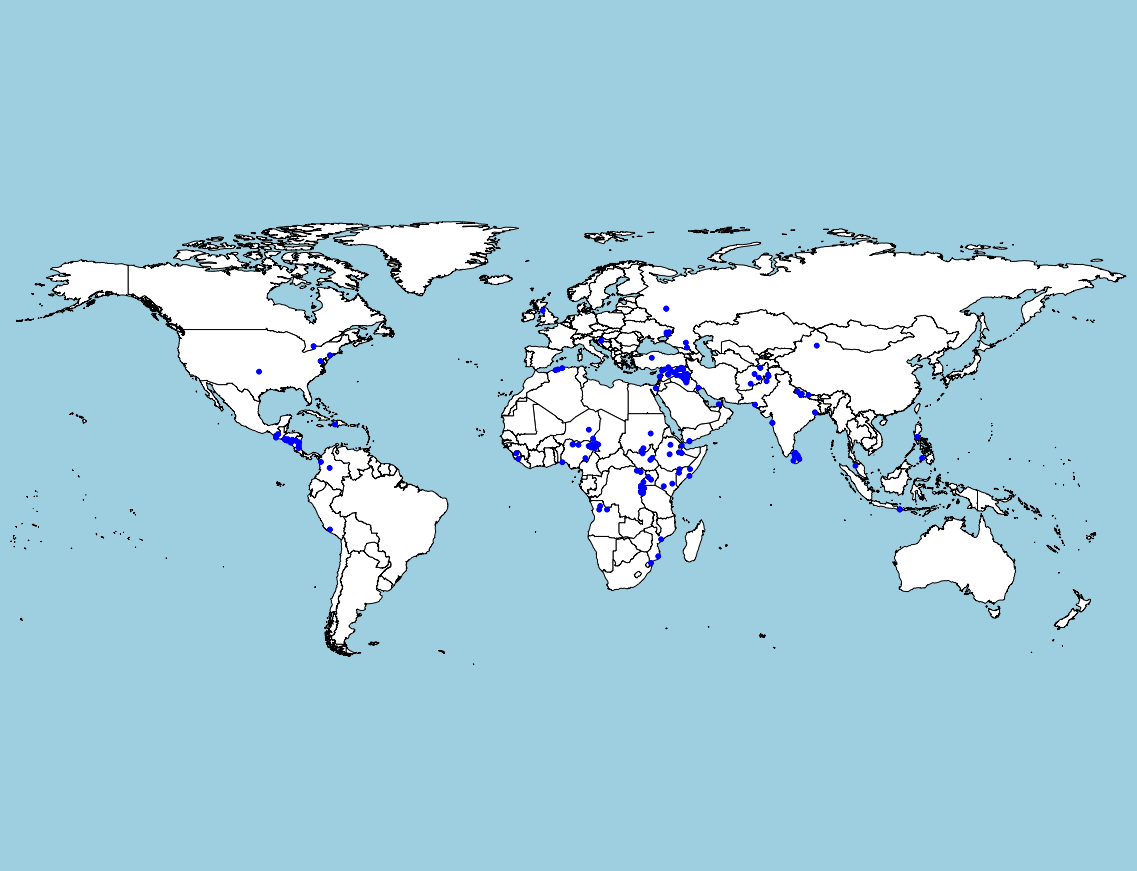
If we further limit the attacks to those with over 100 deaths, we get the following: (206 attacks)
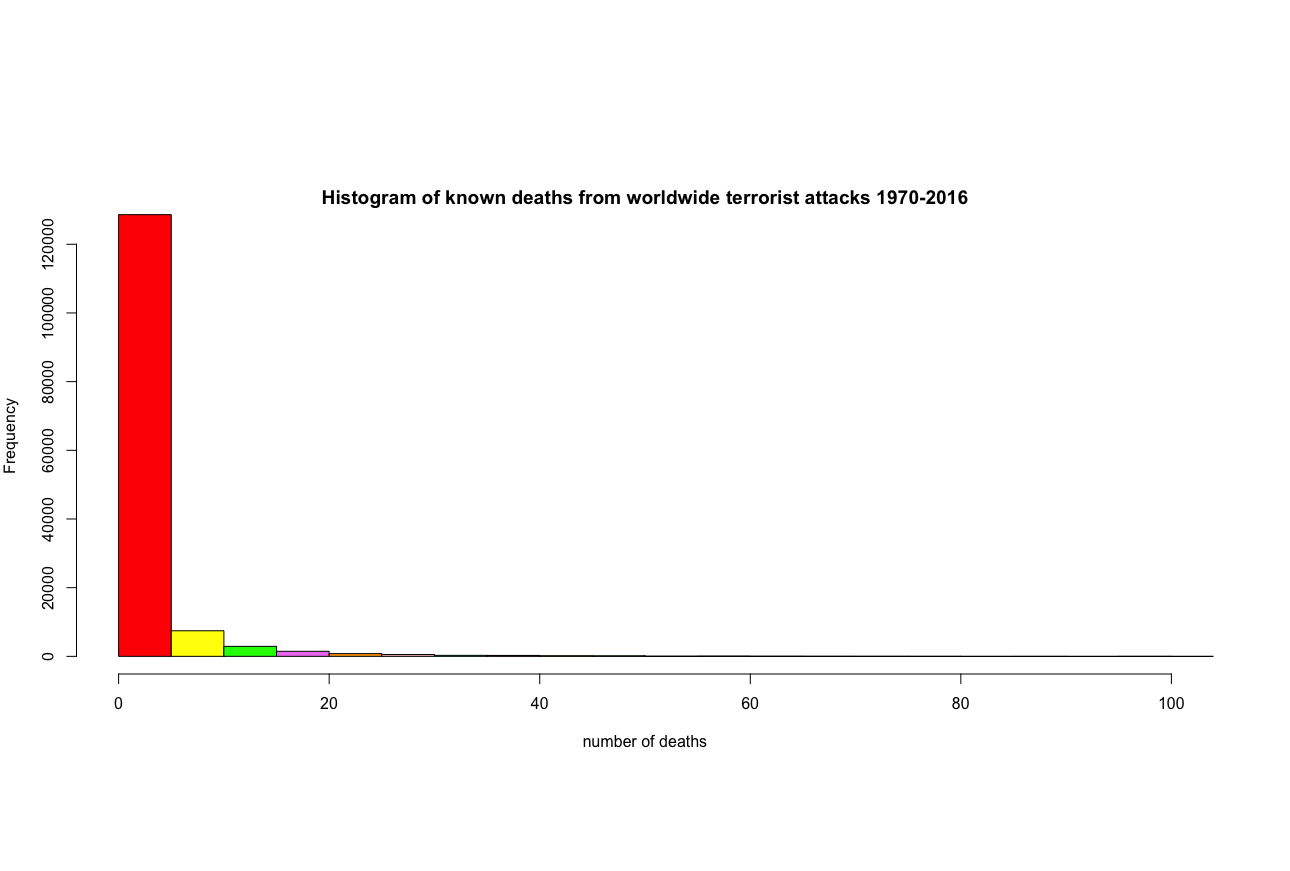
The overall histogram of known deaths from terrorist attacks from 1970-1920, we have the following:
hist(csuccess$nkill, breaks=500, xlim=c(0,100), xlab="number of deaths", col = colors, main = "Histogram of know deaths from worldwide terrorists attacks 1970-2016")
Clustering the Attacks
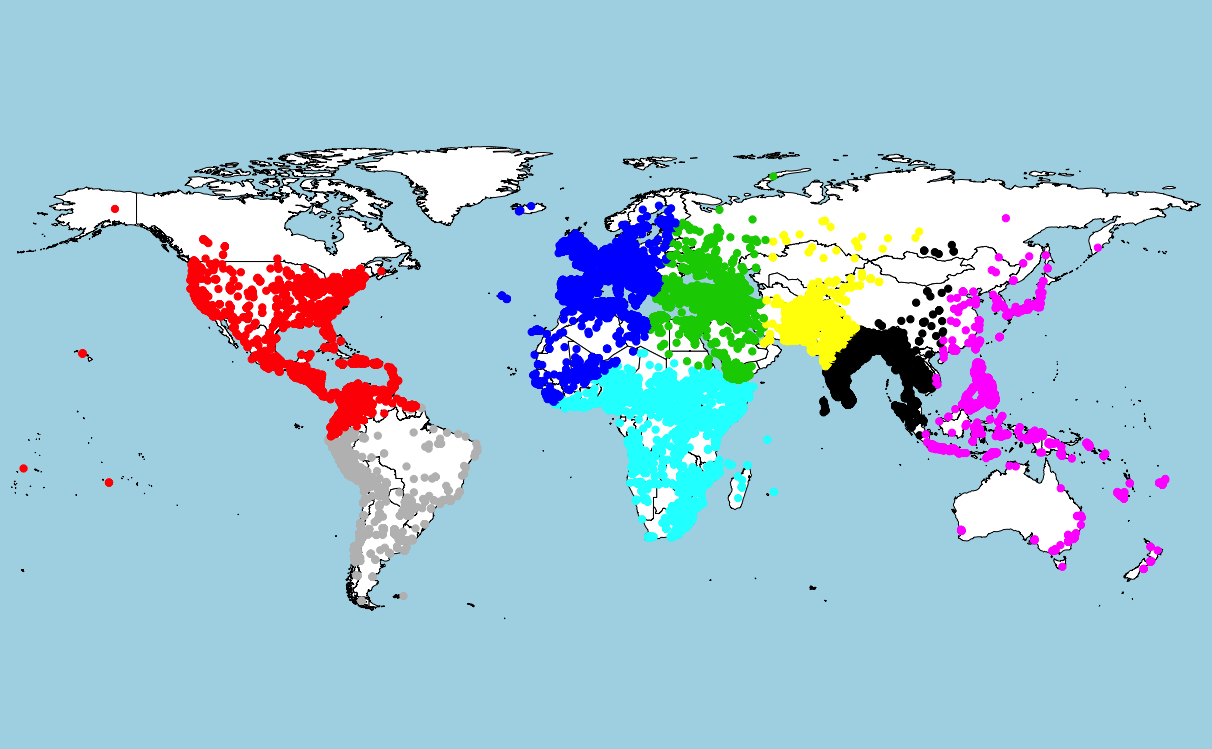
We can use a clustering technique to breakdown where the attacks are happening into regions. The following map shows the attacks, with the number of cluster arbitrarily set to 8. (For more info on clustering see this previous blog post.)
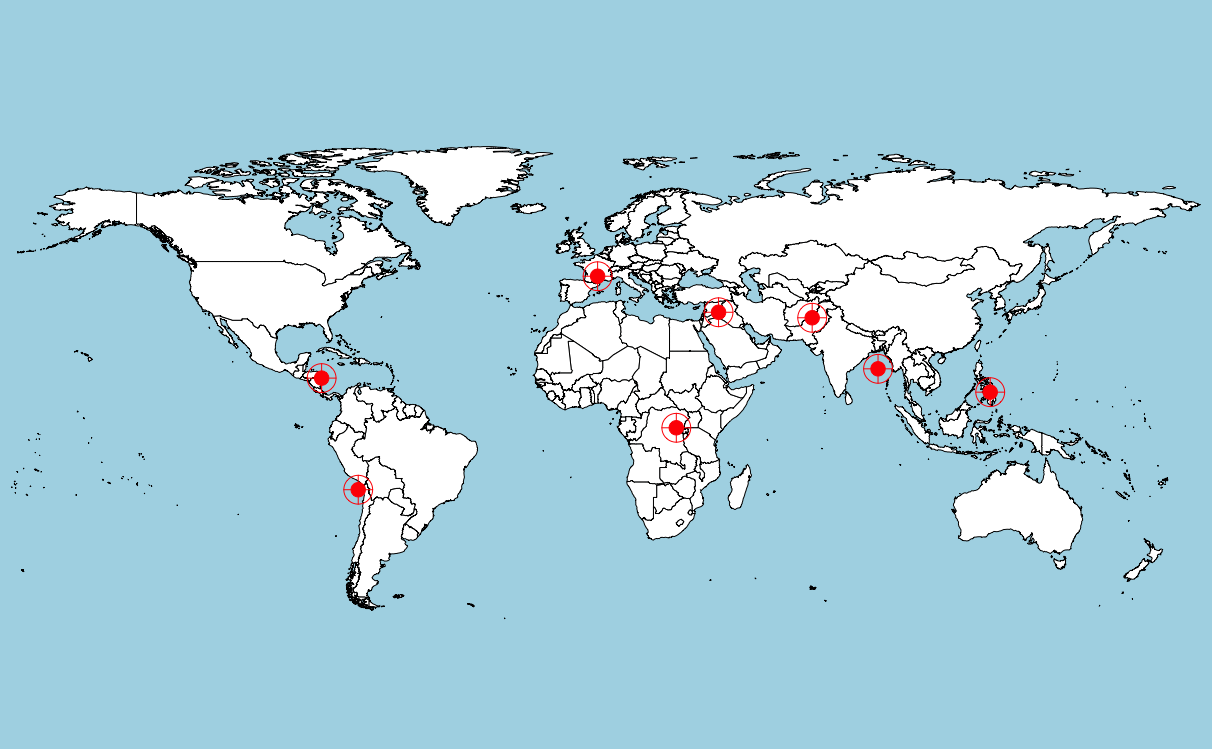
The following map shows the centroids of the clusters. This was generated by first computing the centroids with python as mentioned in the post above. The map was generated in R as follows:
> library(ggplot2)
> library(ggmap)
> library(maps)
> library(mapdata)
> map("world", fill=TRUE, col="white", bg="lightblue", ylim=c(-60, 90), mar=c(0,0,0,0))
> points(centroids$lon, centroids$lat, col="red", pch=19, cex=2)
> points(centroids$lon, centroids$lat, col="red", pch=10, cex=4)
Heat Maps of Terrorist Attacks Worldwide
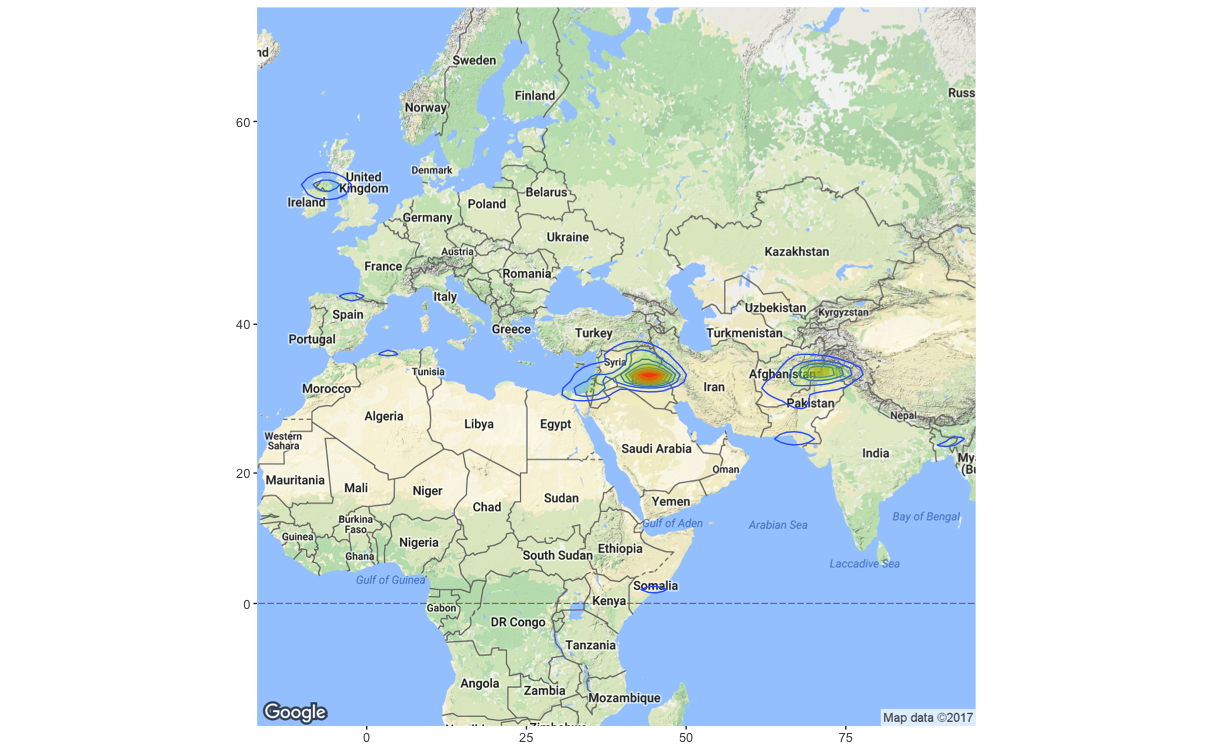
These maps can be somewhat misleading simply because the dots overlap. A heat map reveals where the highest density of attacks have been:
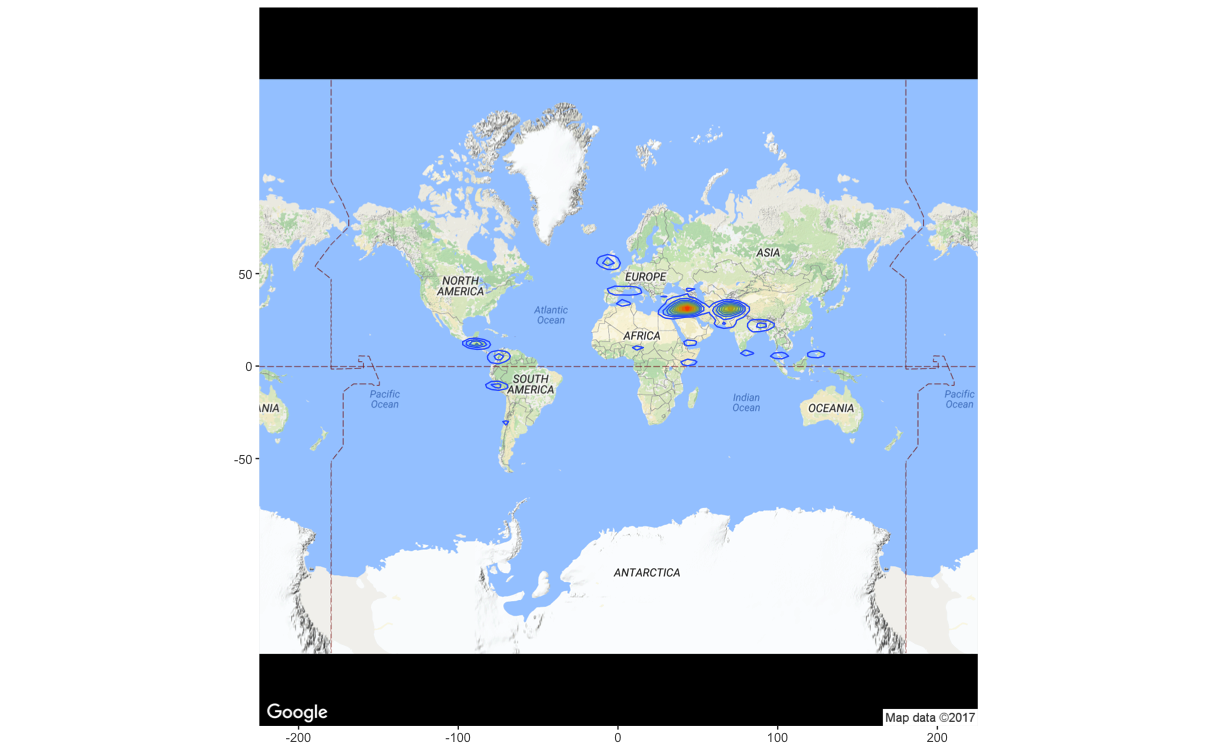
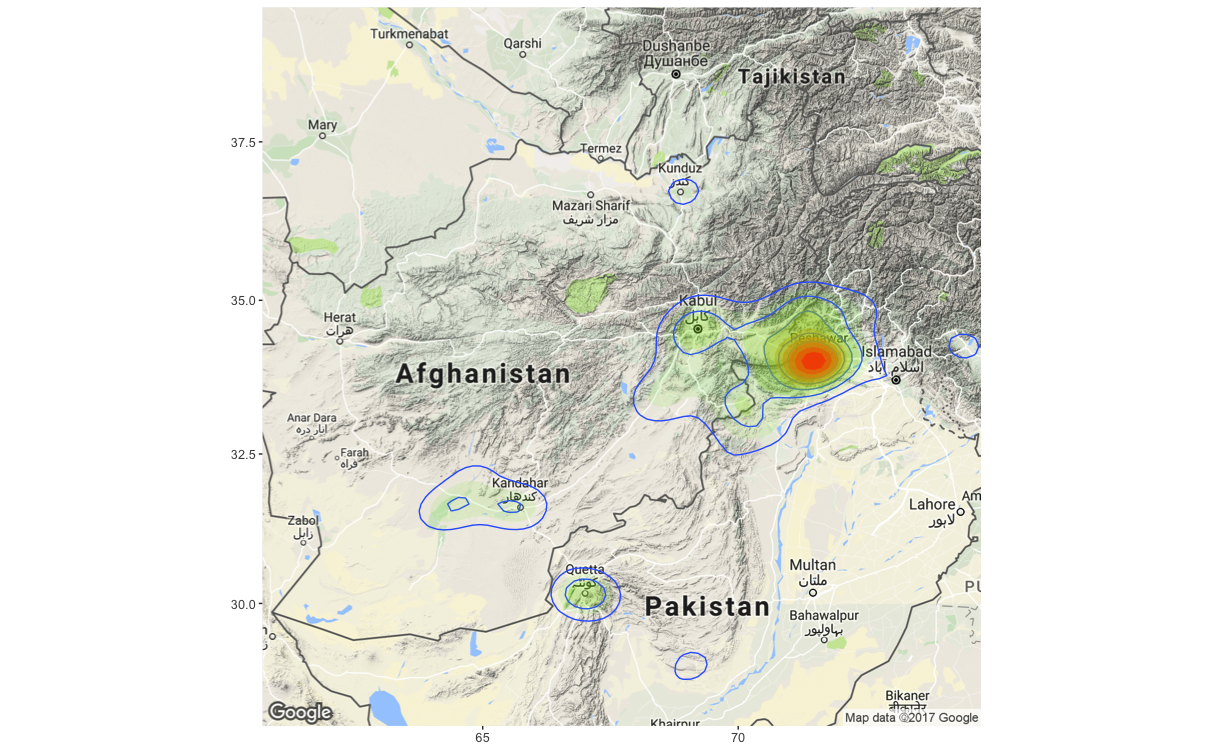
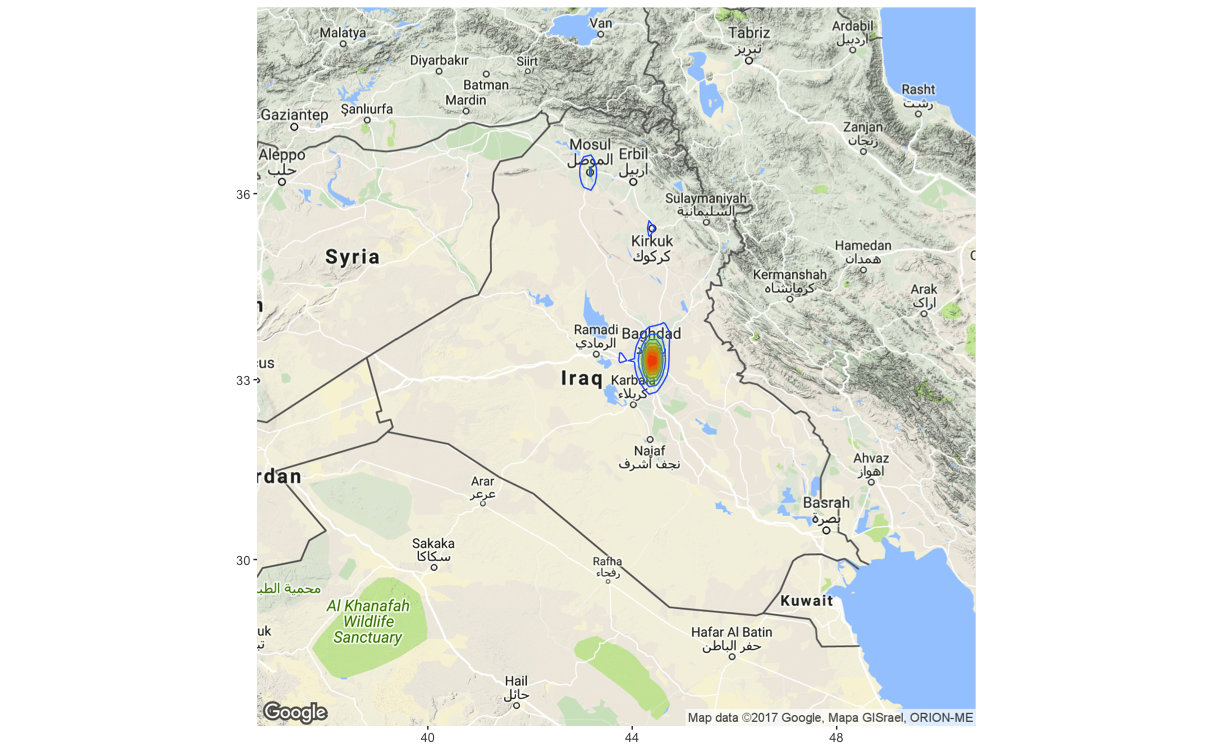
Drilling into the Middle East we can see that the attacks have been primarily centered in Iraq and Afghanistan/Pakistan.
In Afghanistan/Pakistan, the attacks center around Pashawar
And in Iraq, the attacks are clearly centered on Baghdad.
Types of Attacks
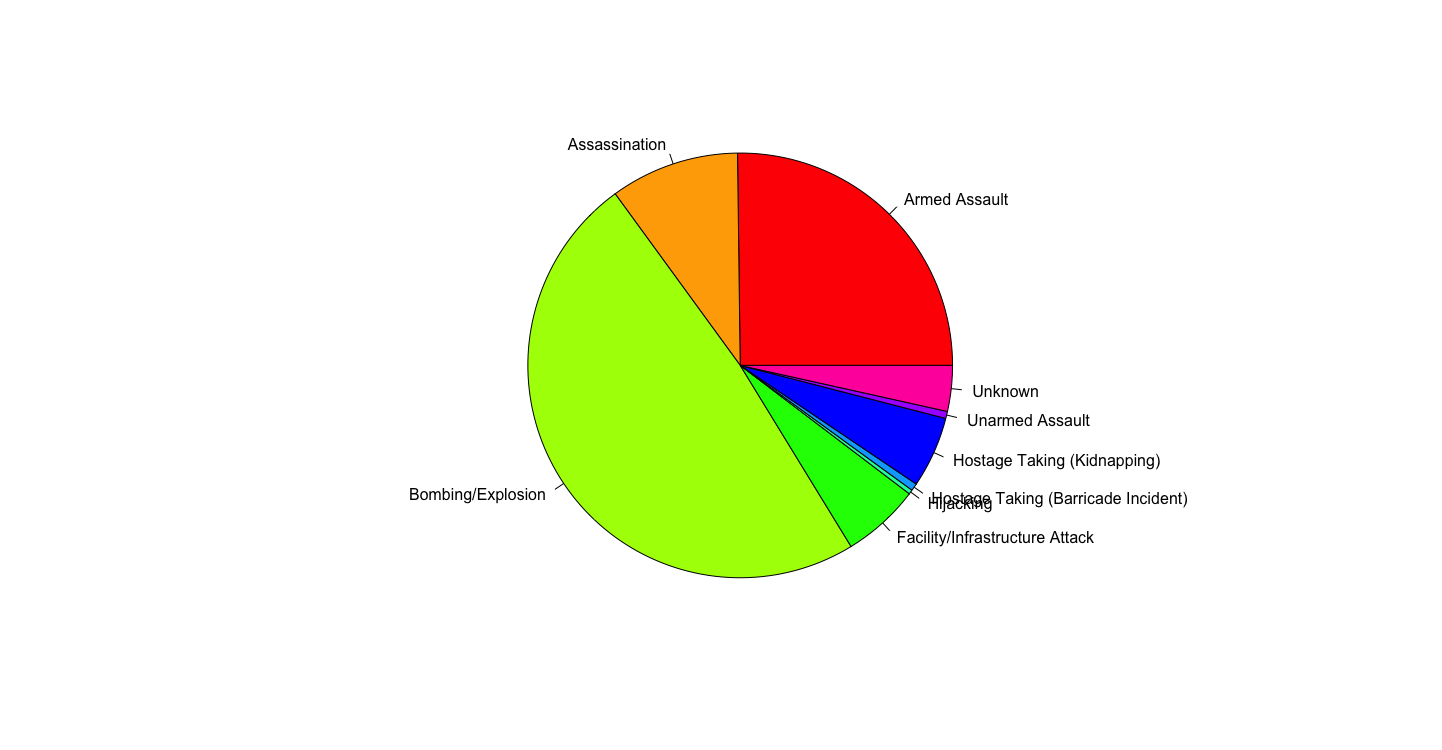
Successful attacks break down into the following types:
> attack_type <- table(csuccess$attacktype1_txt)
> pie(attack_type, col=rainbow(length(attack_type)))
Who Commits Acts of Terror
Note: For the remainder of this post, the datasets are limited to successful terrorist attacks with known victims. For complete data please refer to the GTD provided by the link at the end of the post.
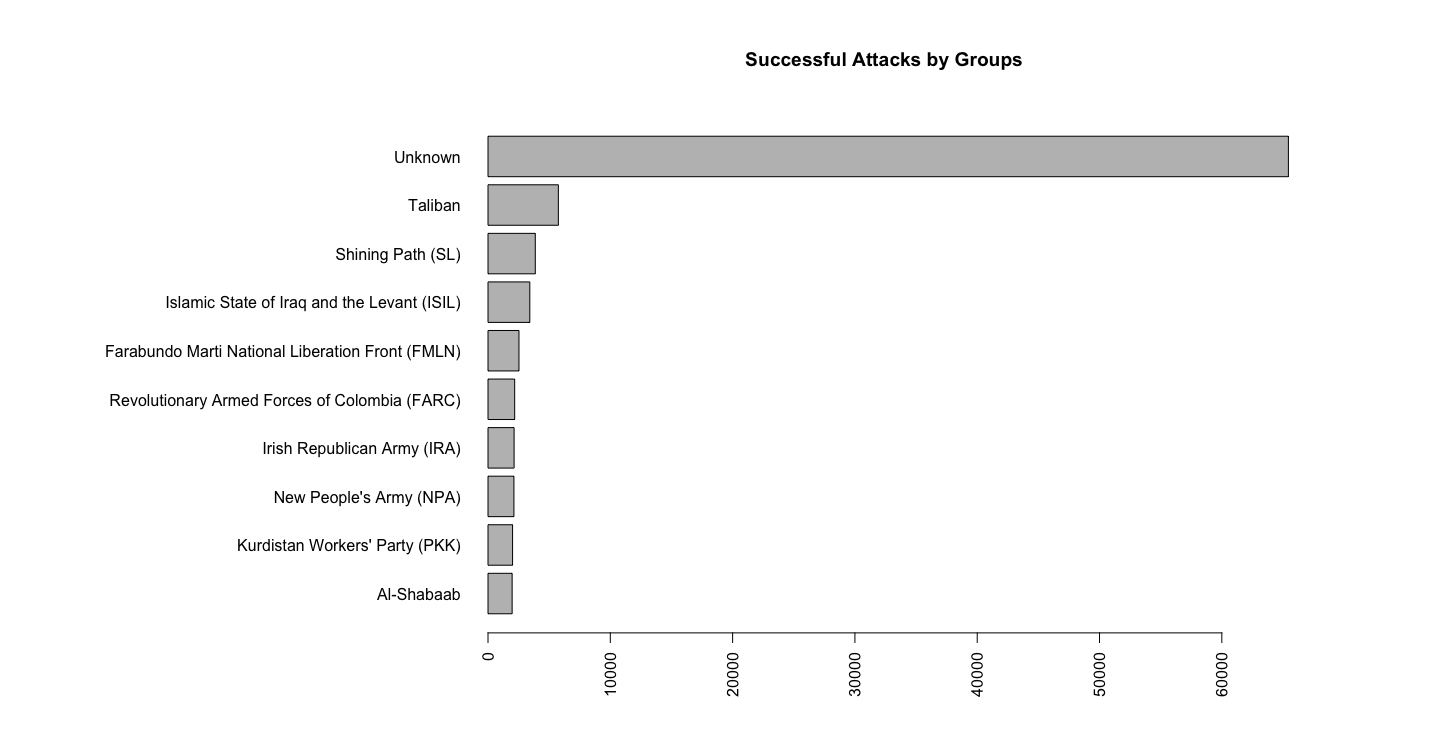
The top 10 groups responsible for the attacks based simply on the number of successful attacks is as follows:
The Targets of Terror
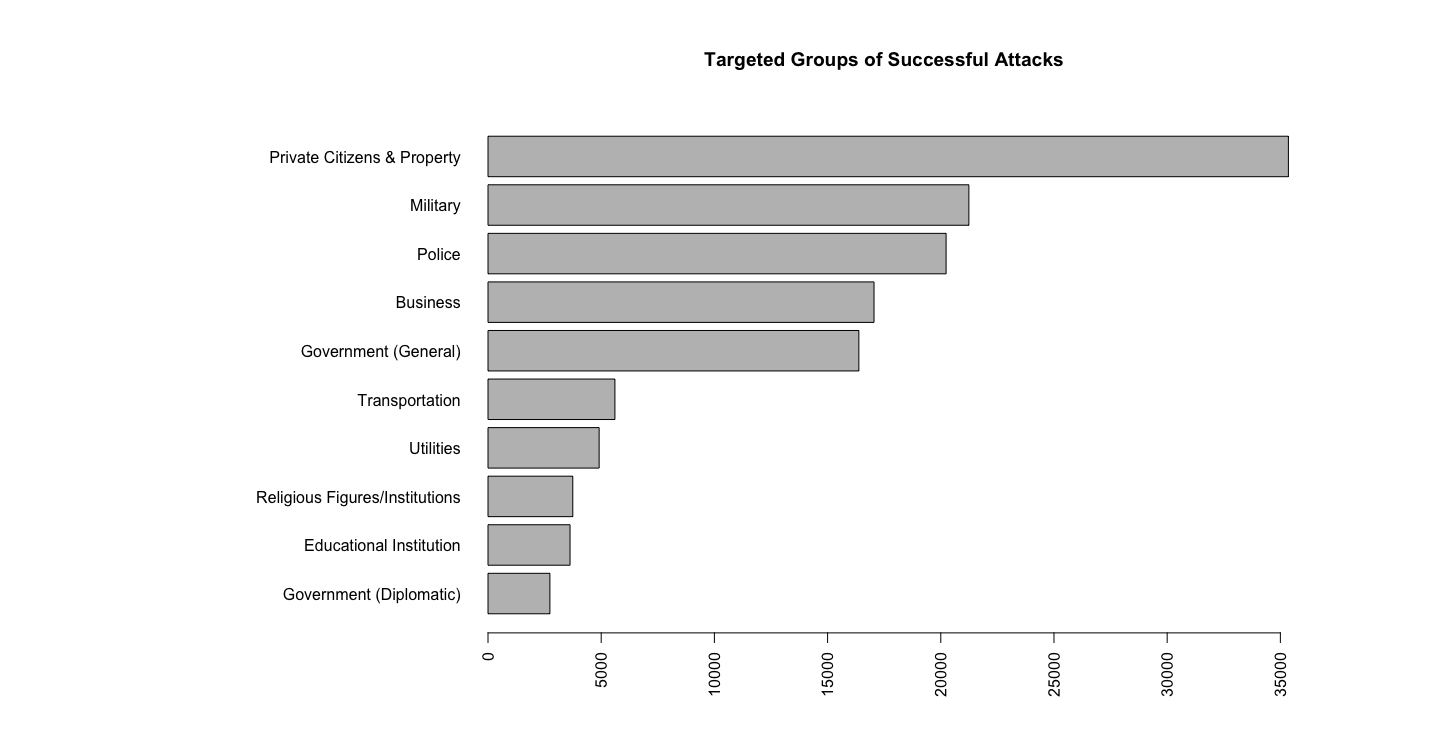
The following is a display of the top 10 targeted groups of successful terrorist attacks between 1970 and 2016:
Terrorism Trends
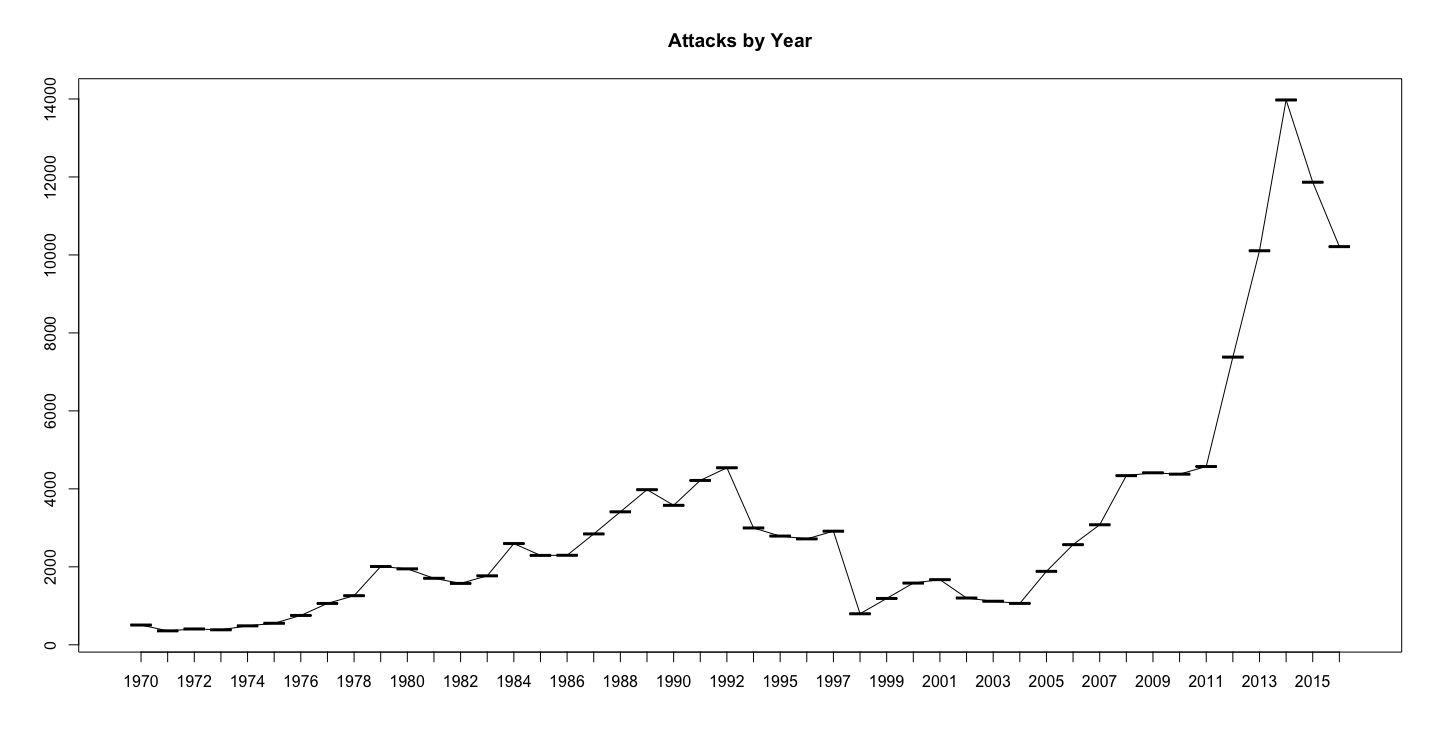
In looking at the trends for terrorist attacks, we see the following:
Conclusions
This post has just scratched the surface of the data behind global terrorism. We can draw the following general conclusions based on the data from the University of Maryland Global Terrorism Database:
- Terrorist attacks have happened throughout the world from 1970 through 2016.
- The highest density of attacks have been in Iraq and Afghanistan/Pakistan.
- Most successful terrorist attacks have resulted in the deaths of 5 people or less per attack.
- Bombing and explosions were used in roughly half of all successful terrorist attacks.
- The groups responsible for most terrorist attacks are unknown, with the Taliban, Shining Path, and ISIL a distant 2nd, 3rd, and 4th.
- The targets of terrorist attacks tend to be private citizens and property.
- The trend of terrorist attacks rose until 1992, then dropped off until 1999 and then started to rise again. The number of attacks peaked in 2014, but has dropped of in recent years.
Again, please note that the above statements were based on analysis of the Global Terrorism Database. Data behind the analysis (with the exception of general geographic information) was restricted to known successful attacks with a known number of victims.
I hope you have found this post informative. It is unfortunate that we live in a world where terrorism is common. It is my hope that seeking to understand the data about the attacks and the motivations of the attackers will help eliminate the threat of terrorism.
Thanks for reading this post and stay tuned for more interesting topics in data science and machine learning.
References
The University of Maryland Global Terrorism Database
Robin Wright “Who Different - And Dangerous - Is Terrorism Today?” - New Yorker Magazine, June 5, 2017
Tori DeAngelis “Understanding terrorism”, American Psychological Association Monitor on Psychology, November 2009, Vol 40, No. 10
R Core Team (2017). R: A language and environment for statistical computing. R Foundation for Statistical Computing, Vienna, Austria. URL https://www.R-project.org/.
D. Kahle and H. Wickham. ggmap: Spatial Visualization with ggplot2. The R Journal, 5(1), 144-161. URL http://journal.r-project.org/archive/2013-1/kahle-wickham.pdf
Reproducible Research Course by Eric C. Anderson for (NOAA/SWFSC)]